Skip to main contentThe Product Usage Dashboard provides a view of record and
active connection usage in Census.
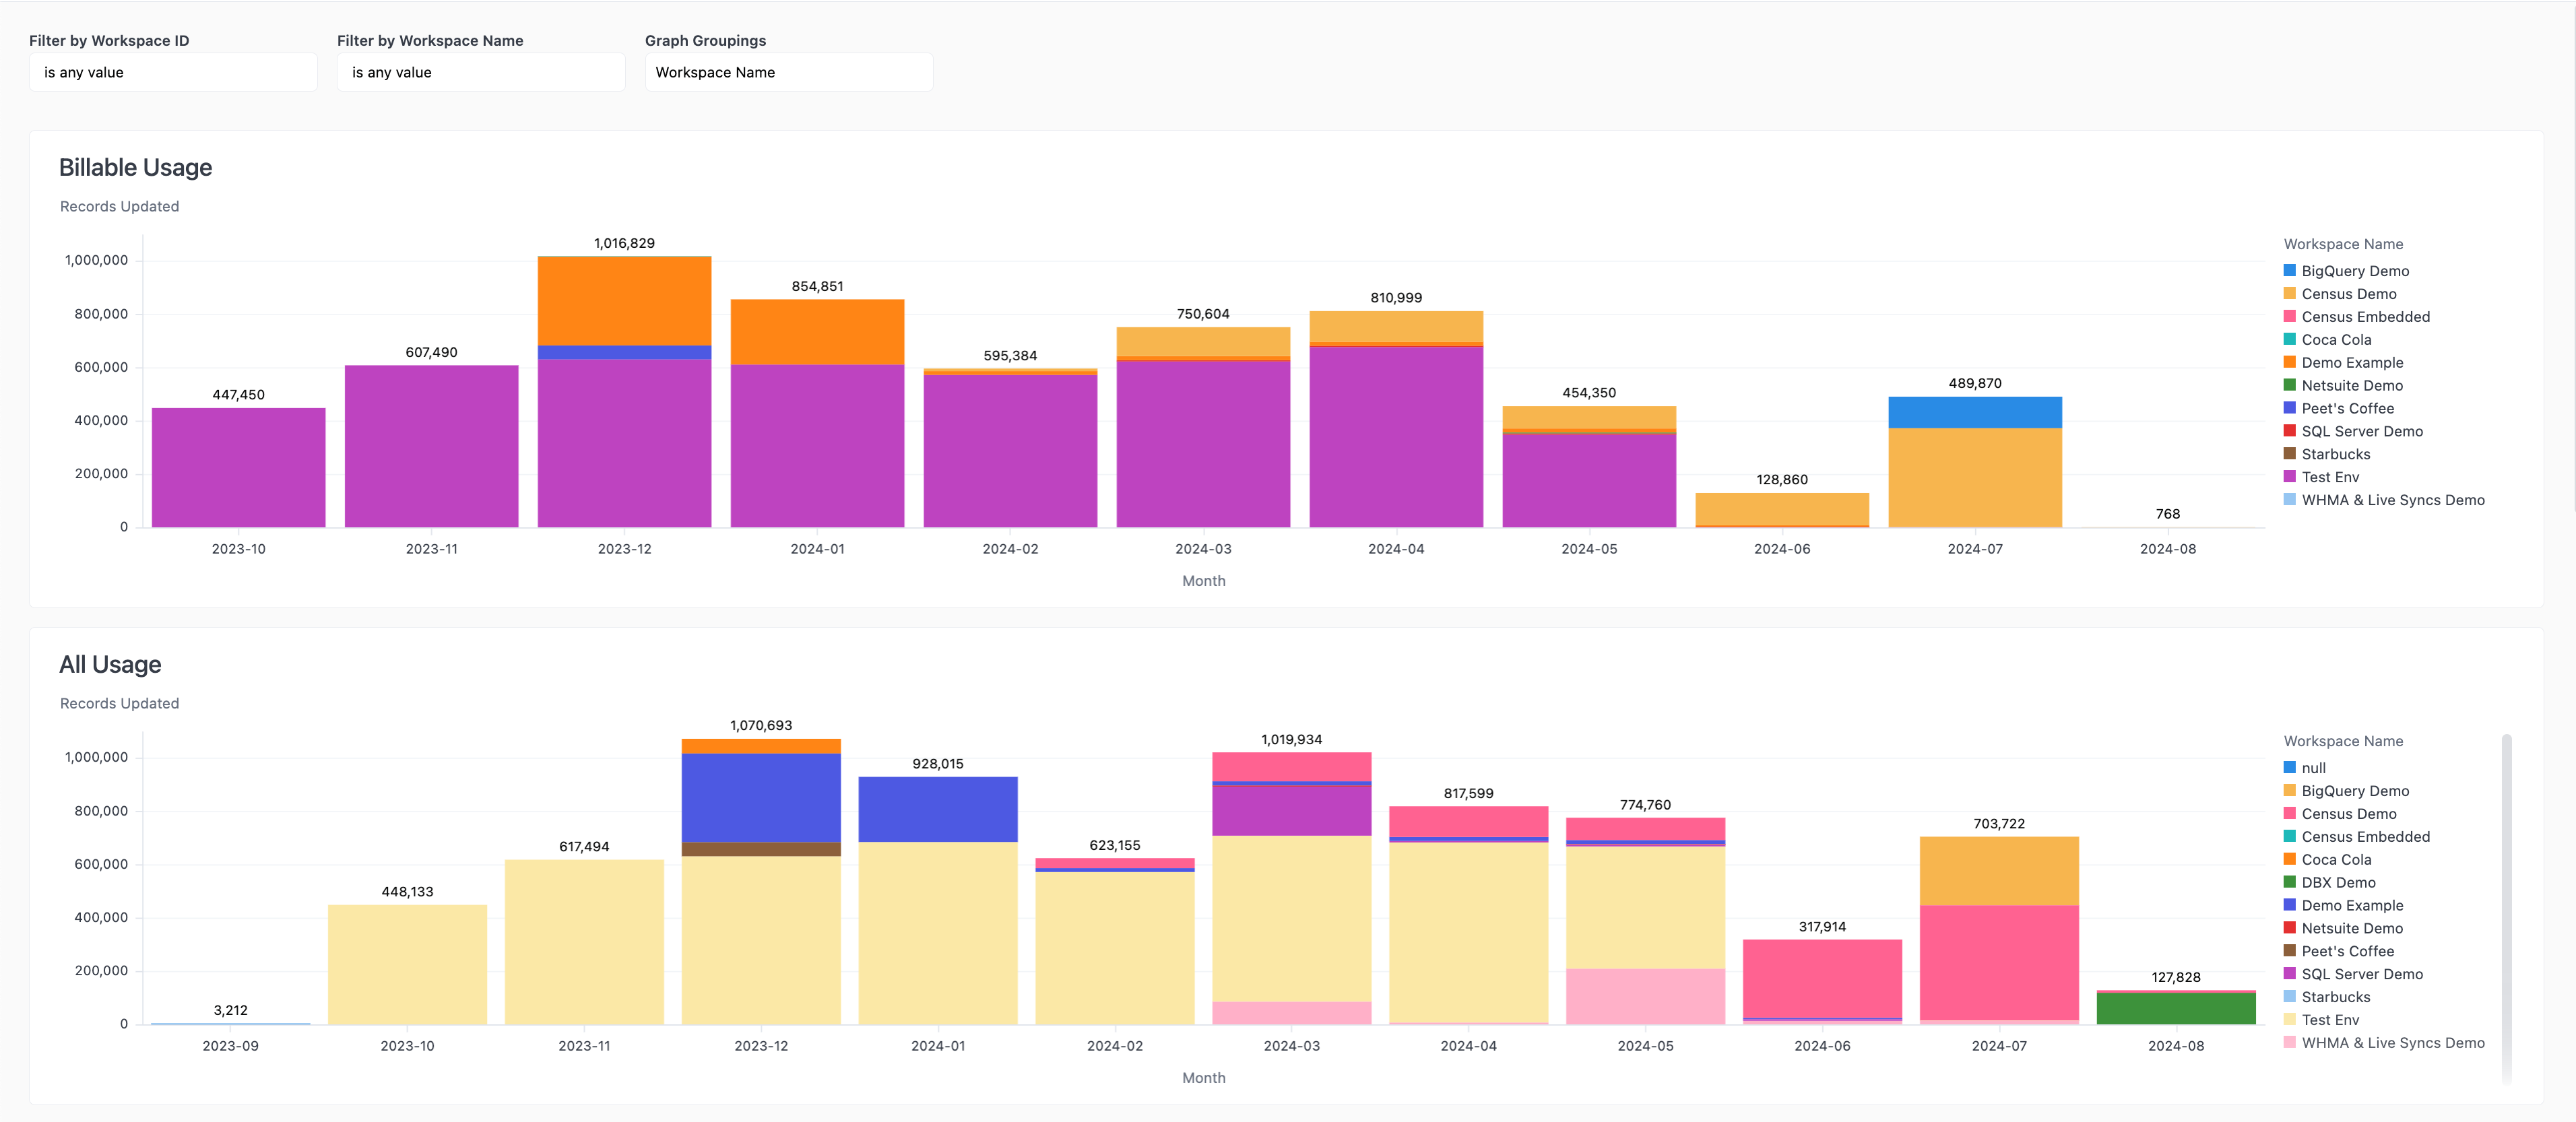
By separating your customers into individual workspaces and monitoring this dashboard, you can track usage and costs on a per-customer basis.
For example, you can:
- Slice each graph by Workspace Name to see which customers are using the most records or connections.
- Filter the entire dashboard by one Workspace Name to see the usage of a single customer.
- See usage trends over time for each customer and monitor spikes.